Re-plot saved data
Problem
Re-create a plot (or table, or other live “subscription”) on saved data.
Approach
In the example Perform a simple scan with a data table and plot, we set up a LiveTable and
LivePlot. We subscribed them to the stream of data coming from the
RunEngine, and they updated live during the scan.
Now, we will make a LivePlot again, using the same code,
but we will stream saved data from the databroker. The table and plot
don’t “know” where the data is coming from; they work just the same on
live data or saved data. The two can even be mixed on the same plot.
Example Solution
These may already be imported in your configuration. If not, import them.
from databroker import db
from bluesky.callbacks import LiveTable
Search for the run in question.
Note
There are many ways to search for data. The simplest is by recency:
db[-1] means “get me the last run”. A more reliable method is to
use the run’s unique ID. See
this section
of the databroker documentation for more.
h = db[-1]
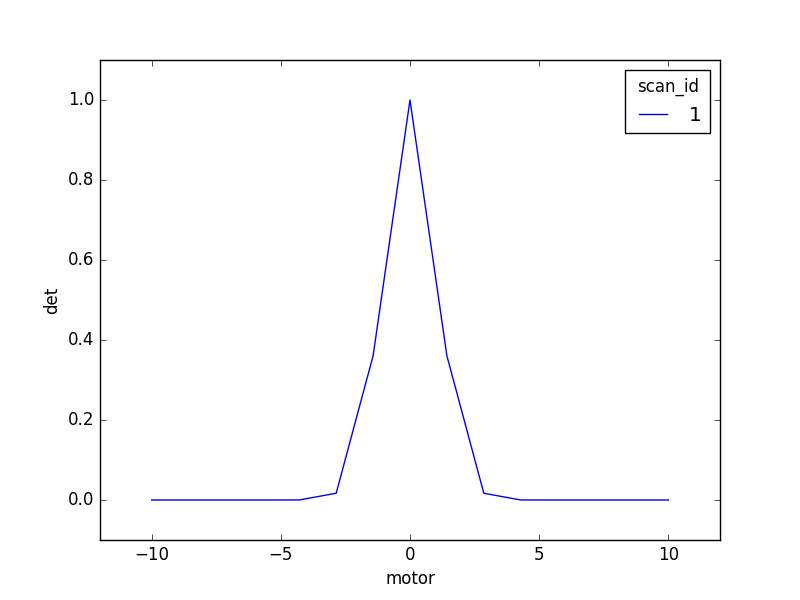
Define a LivePlot, as we did when we collected the data in
Perform a simple scan with a data table and plot.
p = LivePlot('det', 'motor')
Now use the process method of the databroker to process all the data
from h with LivePlot.
db.process(h, p)
We obtain the exact same plot:
To plot more data on the same axes, reuse p. To get fresh axes, define
p again.
For example, to add more saved data:
h  = db[-2]  # the second-most-recent run
db.process(h, p)
To now add live data from a new scan, include p as a subscription.
(For context, refer to Perform a simple scan with a data table and plot.)
subs = [LiveTable(['motor', 'det']), p]
RE(scan([det], motor, -5, 5, 10), p)