MAD-X Simulations#
This section is based on the BL2_Triplet_TDC_full (Beamline 2, transverse deflector cavity in operation) ATF example.
Hint: See the List of predefined simulations in Sirepo for examples of identifiers for different beamlines.
Setup and scan model before changing parameters#
[1]:
from sirepo_bluesky import prepare_re_env

%run -i $prepare_re_env.__file__ -e flyer

import matplotlib.pyplot as plt

from sirepo_bluesky.sirepo_bluesky import SirepoBluesky
from sirepo_bluesky.madx_flyer import MADXFlyer
from sirepo_bluesky.sirepo_ophyd import create_classes

connection = SirepoBluesky("http://localhost:8000")

data, schema = connection.auth("madx", "00000002")
classes, objects = create_classes(
    connection=connection,
    extra_model_fields=["rpnVariables", "commands"],
)
globals().update(**objects)

madx_flyer = MADXFlyer(
    connection=connection,
    root_dir="/tmp/sirepo-bluesky-data",
    report="elementAnimation250-20",
)

(uid1,) = RE(bp.fly([madx_flyer]))
hdr1 = db[uid1]
tbl1 = hdr1.table(stream_name="madx_flyer", fill=True)
print(tbl1)
Transient Scan ID: 1     Time: 2023-08-19 16:53:53
Persistent Unique Scan ID: '4423311f-b3ba-47f4-8f2e-152c9334bcf5'
New stream: 'madx_flyer'
/opt/hostedtoolcache/Python/3.10.12/x64/lib/python3.10/site-packages/event_model/__init__.py:275: UserWarning: The document type 'bulk_events' has been deprecated in favor of 'event_page', whose structure is a transpose of 'bulk_events'.
  warnings.warn(
                                 time      madx_flyer_NAME madx_flyer_S  \
seq_num
1       2023-08-19 16:53:59.934589386  BEAMLINE_FULL$START          0.0
2       2023-08-19 16:53:59.934627056                 HO00          0.2
3       2023-08-19 16:53:59.934648514                HPOP1          0.2
4       2023-08-19 16:53:59.934667349                HT1HV          0.2
5       2023-08-19 16:53:59.934684277                 HO01         0.37
...                               ...                  ...          ...
147     2023-08-19 16:53:59.936988115                 IO20     28.28665
148     2023-08-19 16:53:59.937004328                  IQ9     28.36265
149     2023-08-19 16:53:59.937017918                 IO21     28.86265
150     2023-08-19 16:53:59.937035084                 IP85     28.86265
151     2023-08-19 16:53:59.937055826    BEAMLINE_FULL$END     28.86265

        madx_flyer_BETX madx_flyer_ALFX madx_flyer_BETY madx_flyer_ALFY  \
seq_num
1                  10.0            -1.0            10.0            -1.0
2                10.408           -1.04          10.408           -1.04
3                10.408           -1.04          10.408           -1.04
4                10.408           -1.04          10.408           -1.04
5              10.76738          -1.074        10.76738          -1.074
...                 ...             ...             ...             ...
147         7.511737399     29.28116647     50.70010595    -49.81206671
148         4.955889215     6.950629231     46.35487045     102.4208395
149        0.4927675011     1.975614196    0.5139990441    -10.73909671
150        0.4927675011     1.975614196    0.5139990441    -10.73909671
151        0.4927675011     1.975614196    0.5139990441    -10.73909671

        madx_flyer_DX madx_flyer_DY
seq_num
1                 0.0           0.0
2                 0.0           0.0
3                 0.0           0.0
4                 0.0           0.0
5                 0.0           0.0
...               ...           ...
147      0.2928633271           0.0
148      0.2901702805           0.0
149      0.4938460783           0.0
150      0.4938460783           0.0
151      0.4938460783           0.0

[151 rows x 9 columns]
Scan again after changing parameters#
[2]:
def madx_plan(element=match8, parameter=ihq1, value=1.0):
    yield from bps.mv(element.deltap, value)
    yield from bps.mv(parameter.value, value)
    return (yield from bp.fly([madx_flyer]))


(uid2,) = RE(madx_plan())
hdr2 = db[uid2]
tbl2 = hdr2.table(stream_name="madx_flyer", fill=True)
print(tbl2)
Transient Scan ID: 2     Time: 2023-08-19 16:54:00
Persistent Unique Scan ID: '494cbfd8-50fd-4e5c-a07f-87cd453347cb'
New stream: 'madx_flyer'
/opt/hostedtoolcache/Python/3.10.12/x64/lib/python3.10/site-packages/event_model/__init__.py:275: UserWarning: The document type 'bulk_events' has been deprecated in favor of 'event_page', whose structure is a transpose of 'bulk_events'.
  warnings.warn(
                                 time      madx_flyer_NAME madx_flyer_S  \
seq_num
1       2023-08-19 16:54:05.161034822  BEAMLINE_FULL$START          0.0
2       2023-08-19 16:54:05.161077023                 HO00          0.2
3       2023-08-19 16:54:05.161099195                HPOP1          0.2
4       2023-08-19 16:54:05.161121130                HT1HV          0.2
5       2023-08-19 16:54:05.161140442                 HO01         0.37
...                               ...                  ...          ...
147     2023-08-19 16:54:05.163701057                 IO20     28.28665
148     2023-08-19 16:54:05.163715601                  IQ9     28.36265
149     2023-08-19 16:54:05.163729429                 IO21     28.86265
150     2023-08-19 16:54:05.163745880                 IP85     28.86265
151     2023-08-19 16:54:05.163759708    BEAMLINE_FULL$END     28.86265

        madx_flyer_BETX madx_flyer_ALFX madx_flyer_BETY madx_flyer_ALFY  \
seq_num
1                  10.0            -1.0            10.0            -1.0
2                10.408           -1.04          10.408           -1.04
3                10.408           -1.04          10.408           -1.04
4                10.408           -1.04          10.408           -1.04
5              10.76738          -1.074        10.76738          -1.074
...                 ...             ...             ...             ...
147          1900.02317     -512.983326     939.0523192    -1904.117613
148         1994.298015    -730.7480304     1241.777577    -2068.588869
149         2791.986102    -864.6281425     4171.845384    -3791.546745
150         2791.986102    -864.6281425     4171.845384    -3791.546745
151         2791.986102    -864.6281425     4171.845384    -3791.546745

        madx_flyer_DX madx_flyer_DY
seq_num
1                 0.0           0.0
2                 0.0           0.0
3                 0.0           0.0
4                 0.0           0.0
5                 0.0           0.0
...               ...           ...
147        1.04657493           0.0
148       1.073606624           0.0
149       1.279162206           0.0
150       1.279162206           0.0
151       1.279162206           0.0

[151 rows x 9 columns]
Get the data via databroker API and plot#
[3]:
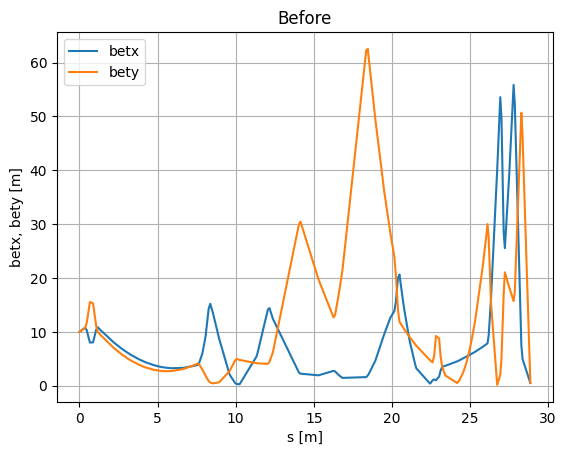
# Before changing parameters
s1 = tbl1["madx_flyer_S"]
betx1 = tbl1["madx_flyer_BETX"]
bety1 = tbl1["madx_flyer_BETY"]

plt.figure()
plt.plot(s1, betx1, label="betx")
plt.plot(s1, bety1, label="bety")
plt.xlabel("s [m]")
plt.ylabel("betx, bety [m]")
plt.title("Before")
plt.grid()
plt.legend()
[3]:
<matplotlib.legend.Legend at 0x7f4ec879d930>
[4]:
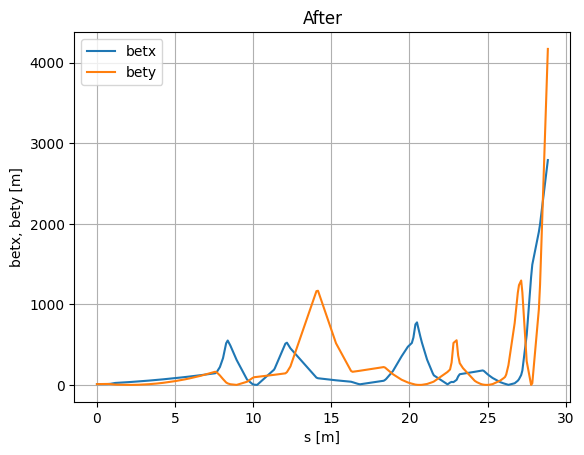
# After changing parameters
s2 = tbl2["madx_flyer_S"]
betx2 = tbl2["madx_flyer_BETX"]
bety2 = tbl2["madx_flyer_BETY"]

plt.figure()
plt.plot(s2, betx2, label="betx")
plt.plot(s2, bety2, label="bety")
plt.xlabel("s [m]")
plt.ylabel("betx, bety [m]")
plt.title("After")
plt.grid()
plt.legend()
[4]:
<matplotlib.legend.Legend at 0x7f4ec8842890>
Get the data from the raw TFS file and plot#
[5]:
import os
import tfs

for name, doc in hdr2.documents():
    if name == "resource":
        resource_doc = doc
        print(resource_doc)

filename = os.path.join(resource_doc["root"], resource_doc["resource_path"])
df = tfs.read(filename)
Resource
========
path_semantics  : posix
resource_kwargs :
resource_path   : 2023/08/19/7ff84c70-f8e9-40c6-9c3e-54b1a0eaee31.tfs
root            : /tmp/sirepo-bluesky-data
run_start       : 494cbfd8-50fd-4e5c-a07f-87cd453347cb
spec            : madx
uid             : f1b0bab5-e885-4e93-b80c-871031e3dec1
[6]:
df
[6]:
| NAME | S | BETX | ALFX | BETY | ALFY | DX | DY | |
|---|---|---|---|---|---|---|---|---|
| 0 | BEAMLINE_FULL$START | 0.00000 | 10.000000 | -1.000000 | 10.000000 | -1.000000 | 0.000000 | 0.0 |
| 1 | HO00 | 0.20000 | 10.408000 | -1.040000 | 10.408000 | -1.040000 | 0.000000 | 0.0 |
| 2 | HPOP1 | 0.20000 | 10.408000 | -1.040000 | 10.408000 | -1.040000 | 0.000000 | 0.0 |
| 3 | HT1HV | 0.20000 | 10.408000 | -1.040000 | 10.408000 | -1.040000 | 0.000000 | 0.0 |
| 4 | HO01 | 0.37000 | 10.767380 | -1.074000 | 10.767380 | -1.074000 | 0.000000 | 0.0 |
| ... | ... | ... | ... | ... | ... | ... | ... | ... |
| 146 | IO20 | 28.28665 | 1900.023170 | -512.983326 | 939.052319 | -1904.117613 | 1.046575 | 0.0 |
| 147 | IQ9 | 28.36265 | 1994.298015 | -730.748030 | 1241.777577 | -2068.588869 | 1.073607 | 0.0 |
| 148 | IO21 | 28.86265 | 2791.986102 | -864.628142 | 4171.845384 | -3791.546745 | 1.279162 | 0.0 |
| 149 | IP85 | 28.86265 | 2791.986102 | -864.628142 | 4171.845384 | -3791.546745 | 1.279162 | 0.0 |
| 150 | BEAMLINE_FULL$END | 28.86265 | 2791.986102 | -864.628142 | 4171.845384 | -3791.546745 | 1.279162 | 0.0 |
151 rows × 8 columns
[7]:
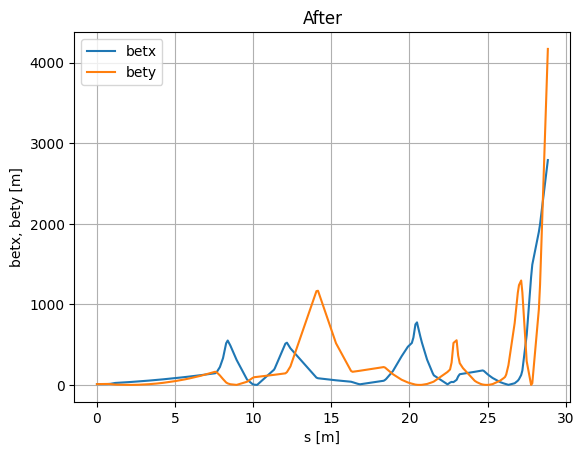
plt.figure()
plt.plot(df["S"], df["BETX"], label="betx")
plt.plot(df["S"], df["BETY"], label="bety")
plt.xlabel("s [m]")
plt.ylabel("betx, bety [m]")
plt.title("After")
plt.grid()
plt.legend()
[7]:
<matplotlib.legend.Legend at 0x7f4ec8616920>
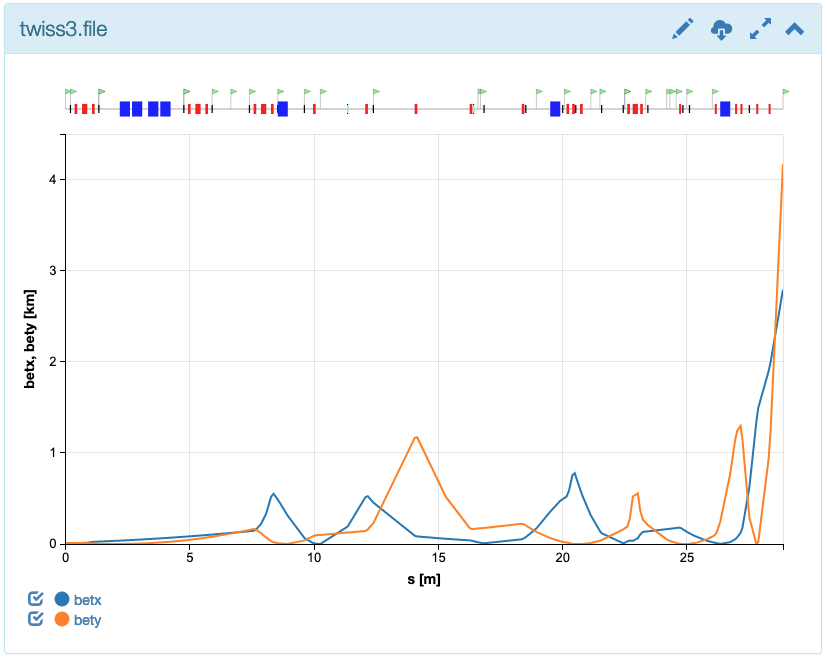
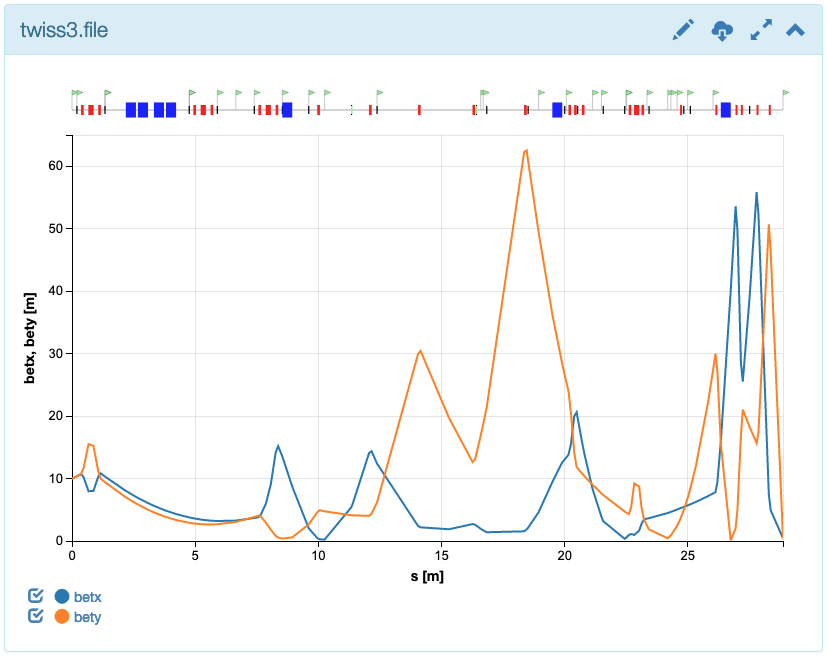
Screenshots from Sirepo Website#
Original model, before changing parameters#
After changing parameters#
